In my quest to earn more from display ads on my site, I recently took the time to work on some ePMV optimizations for a site of mine that is with Ezoic.
If you missed it, then you should check out my guide on 9 easy things you can do to optimize your site for higher ePMVs with Ezoic.
I actually did every single thing in that article and I tracked the before and after to show you my results.
Interested in seeing how it turned out? Let’s dive right in then!
**And as always, I’m an affiliate marketer and this post probably contains affiliate links, meaning I will be compensated if you make a purchase after clicking on my links.
How These Steps Helped My EPMV Almost Immediately
A few weeks ago, as I mentioned, I went through each of the optimization steps to try to improve the EPMV of one of my sites that is with Ezoic.
I started noticing an improvement relatively quickly, though I’m told it can take up to 7 days to see any real movement.
Here’s what my old EPMV looked like (click to enlarge):
Yup, I was seeing an EPMV of $12.21, according to my Ezoic report.
And here’s what my new EPMV looks like a couple of weeks later (click to enlarge):
Boom! Fast forward and I’m at $16.89 for my EPMV.
That’s a $4.68 improvement. I’ll take that shit all day long, even on Sundays.
Did The EPMV Boost Stick After Q4?
If I was reading this on an SEO blog, then here’s what I’d be thinking right now –
Of course it increased because the optimization improvements were done in Q4 when ad rates are at their highest all year.
So, I was really curious how things would look in January, when ad rates bottom out.
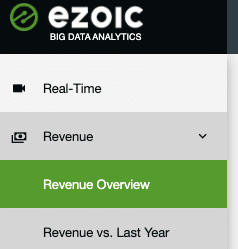
With that in mind, I ran a Revenue Overview report in Big Data Analytics. Here’s where to find that:
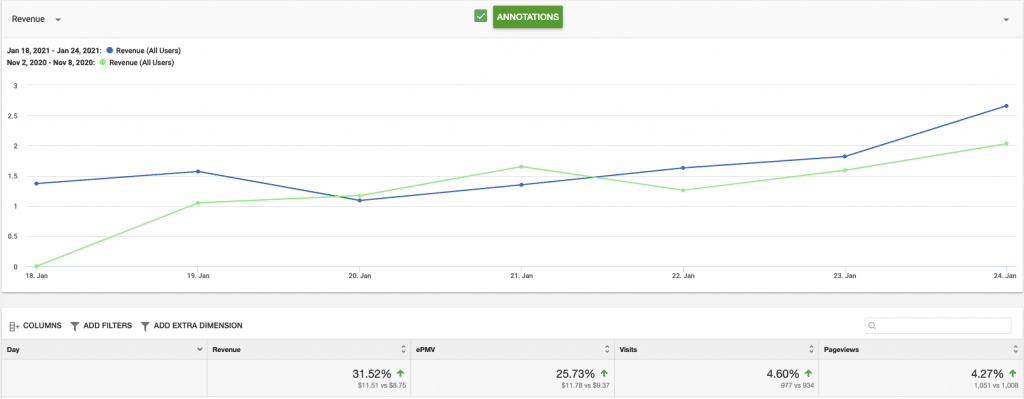
Since I wanted to compare January to before I made the changes on December 4th, I put in the dates of the last 7 days (Jan 18-24, 2021) and compared them to a randomly selected seven-day period in November (Nov. 2-8, 2020).
Here’s what the report shows –

Pretty nifty, eh?
My ePMV is still up and overall revenue is also up here in Q1. Not what I was expecting to see at all.
So, overall I’d say that the optimizations that I made were a huge success for this site.
What Had The Biggest Impact?
There were nine things on my optimization list and you might be wondering which of them gets the credit for this boost that I saw in my ePMV.
Honestly, I think this is one of those situations where you can’t really pinpoint just one thing – it’s all the things.
Let’s take a closer look at what I did that I think may have had the most effect.
Placeholders
Currently, this site has 23 ad placeholders. I ended up adding around 10 ad placeholders when I made my optimizations.
So that means 10 more potential ad slots for the AI to test and try to find the best ad spots on the page. And that is good for getting the most value from the ads on your site.
You can learn more about creating placeholders here.
Wrapping Ads
I was 100% guilty of not having my old AdSense ad codes wrapped. (here’s how to do that)
Wrapping the old ads resulted in a new ad placeholder for my site, and that’s a good thing for optimization.
Anchor Ads
For some odd reason, I did not have anchor ads on for tablets on this site. So, I toggled that on.
When I check Google Analytics for this site, only 3.5% of all the traffic in December was from a tablet.
I honestly don’t think this had that much of an impact for me…except that 3.5% is higher than zero, so maybe it actually did help a little.
Ads.txt File
I did not have an ads.txt file setup for this site, and luckily it was easy to add.
This is something where I have zero clue in terms of it’s impact on my ePMV. So, I found out the deets from Ezoic –
Not having an ads.txt file is likely excluding sites from being able to access certain advertiser campaigns.
So, that means that you’re limiting your income by potentially not having access to some advertiser campaigns.
If you wanna learn more about ads.txt files and display ads, then this might help clear some things up.
Anyways, what I can tell you is that it was super easy to setup and add to my site, so you’ve really got nothing to lose by doing it.
Ad Tester Settings
I went a little crazy enabling almost all of the ad types in my Ad Tester settings.
In-image ads and vignette ads are the only ones that I didn’t turn on, and that was just a personal preference.
I assume it goes without saying that making more ad types available means that there’s potential for more revenue.
I also made sure that Ezoic is on for 100% of my traffic, instead of just 90% of it.
Speed Improvement With The Cache Setting
It’s no secret that ads slow down sites. And it’s also no secret that the faster your site loads, the better it seems to perform.
I know that some SEOs don’t think better site speed matters all that much, but I’ve noticed in the past that my sites get a rankings boost when they see a speed improvement.
And if you’re ranking for more stuff, then you naturally end up with more traffic. And more traffic = more ad revenue (usually).
Now, let me prove to you that working on site speed boosted revenue on this site.
First, I want you to go to Big Data Analytics in your Ezoic account (click on Analytics at the top). And look for Site Speed.
Click on that to open up more options like in the image below.
So, I went to the Slowest Pages report and ran it for the month of December (remember, I made my changes on December 4th) and had it compare it to the previous month (November).
I’m not that well-versed in how to effectively use Big Data Analytics, but I was hoping that this report could tell me if there was a revenue change.
Here’s what running that report showed me –
So, for my slower pages, the revenue went up 55.77% when you compare the two months.
Now, what’s weird is that some of the pages that saw a boost in revenue/ePMV actually were taking longer to load in December (I assume from me enabling more ads).

And the traffic to the page actually increased (despite it being the month of Christmas, this was not an article that I would expect to pop in December).
Since Q4 is historically the time of year with the highest ePMVs, I was curious what this slow pages on the site are looking like now in January compared to before I made these optimizations.
So, I ran this same Slowest Pages report and this time I compared the last 7 days with Nov. 2-8, 2020.
Here’s what that looks like:

This is where it gets really interesting.
Okay, so first let me tell you that this top slowest page is not the same page that came up first in the earlier report.
Four interesting takeaways from this report:
- Overall revenue is up
- Revenue for this particular post is down (to $0.23 from $0.32)
- Traffic for this particular post is down by 52%
- Page RPM for both this particular post and overall is up
Final Thoughts
Overall, I’m really glad that I took the time to make those optimization changes to my site since we’re now in Q1 and the boost in my ePMV seems to have stayed around.
To be honest, I didn’t really expect much from this experiment and I’m really pleased with the results.
I feel like there is a lot to Ezoic that I don’t fully understand (yet) in terms of how to utilize the data to improve my site’s revenue.
For this update, I spent a lot of time digging around Big Data Analytics to find evidence of the improvements to the ePMV and it’s really overwhelming.
I plan on immersing myself in that a bit more so that I can hopefully give you more tips on the best ways to use Ezoic.
And if you still need to make those optimization changes to your Ezoic site, then you can find that guide here.
Hey, I’m Shawna. I make a living working from my laptop in places like London, Sydney, Dubai, Rome, Oslo, Bangkok, Las Vegas, Barcelona, and Amsterdam. I share how I do some of that on this website.


